![]()
Normal Distribution
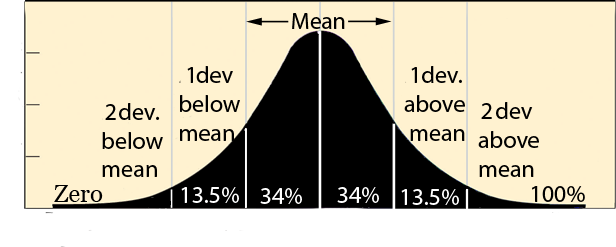
From here on I am going to be using a common statistical graph called a Normal Distribution(ND) for two reasons.
1) I need to paint a clearer picture of what I am saying, and 2) I need to make it clear that I am not putting all people or any group into a box. Of course not all CEOs are greedy to the point of being sociopathic, some are very good, not all self-called conservatives are easily conned, etc. To do this I am putting the the psychopath’s traits and attributes on what’s call a normal distribution. A normal distribution is a statistical graph, which is called “normal” because if you plot anything that happens in nature, like the way people or animals behave, or the physical attributes like height, IQ, beliefs, on and on, the graph will always make a bell shaped curves, and will give a picture of how people and things differ.
Remember it is just a scale with the lowest on the left to the highest, heaviest, smartest etc. on the right. As the scale goes up, or to the right, the number of people or things in the category gets larger, which makes the hump in the middle larger. The hump is called the mean; where most people or thing are. This scale is going to paint a clearer picture of the serious problem we have in this country, which is mainly from the psychopaths at the bottom of the empathy scale.
